
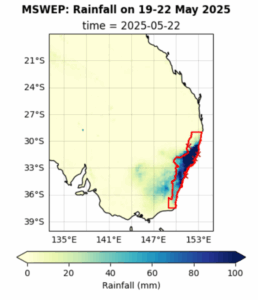
From May 19 to 23, heavy rain caused widespread flooding across eastern New South Wales. Coastal areas saw more than 100 mm of rain each day. The Mid North Coast around Newcastle, Taree, and Port Macquarie recorded the heaviest downpours.
Lives Lost and Widespread Damage
The floods killed five people, forced the rescue of 700 others, and left 50,000 isolated during and after the event. Farmers suffered some of the worst losses, with many losing livestock and feed for their cattle. The full scale of the damage will become clearer in the weeks ahead.
Investigating Climate Change Links
To find out how much human-caused climate change influenced this heavy rain, scientists from Australia, the US, the Netherlands, Sweden, and the UK ran an event attribution study. They used published, peer-reviewed methods to study rain that fell from May 19 to 22, focusing on the Coastal New South Wales Region highlighted in Figure 1.
The affected region sits between southern and northern Australia, making it a climatic transition zone. Southern Australia shows a clear drying trend in the colder months, while rainfall in the north is less predictable. The event’s timing also played a role, as May marks the shift from warmer to cooler weather.
To capture this complexity, the team used two event definitions. One focuses on the season from April to June (AMJ). The other considers the wettest four days of any year, since extreme rain and flooding can strike this area at any time.
Ongoing Exposure and Repeated Impacts
The Mid-North Coast has several major rivers with low-lying floodplains and coastal towns that hold the region’s main urban centres. In recent years, this area has endured severe floods and bushfires, showing just how exposed people and infrastructure are to repeat disasters. Communities now face the strain of back-to-back emergencies and recovery fatigue. Rural areas feel these impacts the hardest. They often deal with greater property damage, isolated roads, and limited services during disasters.
The Bureau of Meteorology issued a flood watch three days before the event. This early warning helped move supplies and trigger evacuations in high-risk zones, likely reducing the worst impacts.
Frequency of Extreme Rainfall
Gridded data for the region (see Fig. 1) show that this level of extreme rainfall is not unusual for today’s climate. Events like this happen about once every ten years in the April–June period and about once every three years when looking at the full year. However, smaller local areas faced rainfall so extreme that it broke records for some communities.
When comparing today’s AMJ rainfall with a 1.3°C cooler climate, the likelihood and intensity drop by about 17%. But looking at the annual RX4-day value, the same warming makes these events more likely and slightly stronger. Best estimates suggest that warming has about doubled the odds of an event like this in 2025 and increased its intensity by around 10%.
Challenges in Climate Signals and Planning
Scientists used climate model data to test the role of human-driven warming. The models disagree widely. Some show sharp increases in heavy rain, while others show decreases — both for seasonal and annual extremes in a warmer world. Because of these big differences, combining the results does not produce a single clear answer.
Researchers also studied if atmospheric patterns have changed. They compared 1950–1980 with 1994–2024. Results show a seasonal shift: patterns linked to heavy rain appear less often in March but more often in May. Modern events also deliver more rain than similar past setups. Still, some of these patterns don’t always bring rain, making conclusions harder to pin down.
Understanding how climate change shapes heavy rain here remains difficult. Models still clash, and the region is too small for broad models to fully capture local detail. This means both drying and heavier rain remain possible. Flexible plans are essential. “Low-regrets” measures like nature-based solutions, better water storage, and smart risk management can help communities cope with both extremes.