
On 7 March 2025, Bahía Blanca, Argentina, faced an unprecedented rainfall event. More than 300 mm of rain fell in just 8 hours, which is nearly half of the city’s yearly average. This extreme heat and flooding was the heaviest in the city’s recorded history, from 1956 to the present. A cold front triggered the event after several days of hot, humid weather.
A week earlier, Bahía Blanca had already received over 80 mm of rain. This likely contributed to soil saturation before the flooding. A larger region, including Buenos Aires, had faced extreme heat since mid-February. Temperatures exceeded 40°C in northern Argentina, southern Brazil, Paraguay, and Uruguay. Between 19 February and 8 March 2025, 61 cities in central-north Argentina recorded heatwave conditions.
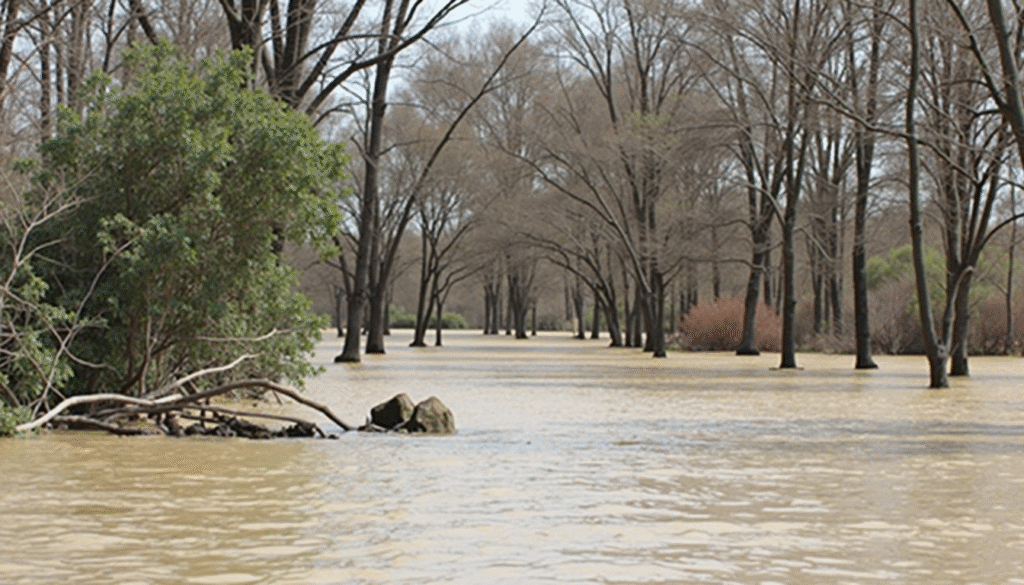
The extreme rainfall on March 7th affected over 300,000 people, with 16 reported deaths, 1,400 being displaced (A24, 2025) and two persons still missing (La Nación, 2025). The damage estimated in the city amounts to 400 million USD (Ámbito, 2025).
At the same time, heat alerts were issued in 15 provinces, with record temperatures in the north (Buenos Aires Herald, 2025, SMN Argentina via X). Buenos Aires faced blackouts and traffic disruptions affecting hundreds of thousands due to peak energy demand (Global Times, 2025, AP News, 2025). While no data on heat-related mortality is available at the time of writing, past events have shown increased mortality risks associated with events like this (Chesini et al., 2019; Chesini et al., 2021, Pinotti et al., 2024).
Researchers from Argentina, Kenya, the Netherlands, Sweden, Denmark, Mexico, the United States, and the UK conducted an attribution study. They aimed to assess how much human-induced climate change affected the likelihood and intensity of the heavy rainfall. This rainfall led to severe flooding and extreme heat. The study focused on the region most affected. This area matches where authorities issued flood warnings (Fig. 1a), as well as for the extreme seasonal heat in the wider area (Fig. 1b).
For this larger region, we calculated the heat index. This index combines high temperatures and humidity. It helps assess the role of climate change in the heatwave just before the extreme rainfall (Fig. 1c). In Argentina, rainfall affected the impacted areas intermittently between March 1 and 7. We therefore studied changes in the wettest 7-day period over the study region.
The heat was especially intense in February and March. However, early hot spells since January made the whole season exceptionally warm. This is important for understanding the overall impacts. Therefore, we focus on the summer season (December to March) to define the heat event’s timeframe.
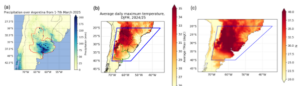
Figure: (a): 7-day accumulated rainfall during 1-7 March 2025, based on MSWEP data. The study region is highlighted in red. The scatter plots show the rainfall accumulations for the same period from 25 weather stations by the National Weather Services (NWS).
(b) The average of daily maximum temperature during 1 Dec 2025 -18 March 2025, based on MSWX dataset. The map highlights the study region — the Southeast South America domain (SES domain) — in blue. (c) Average Heat index (HI) during 15 Feb-7 March, 2025, based on ERA5 dataset. The blue highlight shows the SES domain.
Main findings
- In Northern Argentina, including Buenos Aires province and CABA, extreme heat and heavy rainfall are growing more intense and frequent. Back-to-back extremes—such as heat followed by heavy rain or hot, dry spells—increase the risk of complex hydrometeorological hazards. CABA’s aging population, urban development, and high population density increase both exposure and vulnerability to these hazards.
- Almost half of the urban population works in the informal economy. Many urban livelihoods are highly sensitive to climate shocks like job disruption and extreme heat exposure.
- Based on gridded reanalysis products, we found the extreme heat event is rare. It is expected to occur in today’s climate about once every 50 to 100 years. However, in a 1.3°C cooler climate, extreme heat such as observed in the summer 2024/25 would have been virtually impossible. We repeated the analysis for the shorter hot and humid heat wave before the rainfall. The results showed a similarly large role of human-induced climate change.
- Climate models also show that climate change is making such temperatures much more frequent and intense. However, the increase shown by the models is smaller than that in the reanalysis products. This likely means the models underestimate the effect of climate change. Still, looking to the future, models show a strong upward trend. This trend grows with future warming, making such an event common in a climate 2.6°C warmer than pre-industrial levels.
- The influence of climate change on the rainfall event is much less clear. All 35 weather stations in the area show a 7–30% increase in heavy rainfall intensity. This increase is linked to 1.3°C of global warming. However, none of the available gridded reanalysis products reflect this; on average, they show a decreasing trend instead.
- Climate models largely agree with the station data. On average, they show an increase in the likelihood and intensity of heavy rainfall like that observed in early March. Most models also show a similar increase with an additional 1.3°C of warming, representing a total warming of 2.6°C. However, not all models agree.
- Both station data and model data show that extreme rainfall increases as temperatures rise, which matches expectations for this type of rainfall in a warming climate. Thus, it is likely that climate change increased the likelihood and intensity of the heavy rainfall. However as station data and gridded data do not agree on the sign of the trend we cannot reconcile the two and make a conclusive statement.
- These consecutive events highlight a bigger challenge. Managing more frequent and intense hazards in the province is difficult. Urbanization, weak infrastructure, and social inequalities increase vulnerability.
- As extreme weather events become more common, it is important to invest in early warning systems and climate-smart urban planning. Preparedness should consider multiple hazards. For example, adding more green and blue spaces can cool cities, provide relief during heat, and reduce flood risks—even in densely built areas.